Chapter 3 of our Bike Geometry 101 series

To wrap up our series on geometry, we’re going to explain why you shouldn’t rely on the manufacturers to get it right, and how to gather your own data.
Previous Bike Geometry 101 features
- Tech feature: taking a deep dive into mountain bike geometry
- How to change your mountain bike’s geometry
As we all know, buying clothes is not an exact science. One pair of jeans with a 32in waist can be tighter or looser than another pair with the exact same measurements. And while you can go into a shop and try clothes on, you can’t do that with something that is sold exclusively online. Taking a punt on a new outfit online can be a gamble. It’s no different when buying a new bike, whether from a bike shop or off the web, and even with the best returns policy in the world, making a mistake quickly becomes a huge hassle.

When digital design meets physical reality, wiggle room is inevitable
Obviously the best approach is to go to a good dealer or attend a demo day and physically try the bike. If that’s not possible the next best option is to make an educated guess about how a bike is going to ride and fit based on its geometry. How do you do that? First, you need to read the previous two parts in our Geometry 101 series. In part one we explain how all the different aspects of geometry affect handling through the lens of weight distribution. In the second part, we cover different ways to manipulate bike geometry, from fitting angle-adjust headsets to mixing and matching wheel sizes, all to achieve the numbers and handling you desire.

Pay special attention wen buying a bike from a direct-sales brand
In this, part three, we’re going to take a deep dive into reading manufacturers’ claimed geometries and why they rarely translate into real-world numbers. Every brand publishes a sizing guide and a geometry chart to go with each model, but just how accurate are they?
To find out, we took a look at eight different bikes we’ve tested in the last year. It’s by no means an exhaustive list, but it gives a good snapshot of the degree of variation from the claimed geometry figures. All of them were weighed and measured by ourselves in our workshop using the exact same method we use on all the bikes we test, and we’ll walk you through that process in just a minute. As well as lengths and angles, we also measure the vertical wheel travel of all the suspension bikes we test, so that you know exactly what you’ll get from the bike in real-world situations. And of all the measurements, rear wheel travel is one of the most critical, and not because there’s an appreciable difference in performance from a 160mm bike that delivers 10mm less travel than claimed. Knowing the precise amount of travel helps us make informed decisions about other aspects of the dynamic geometry, especially if you’re using the numbers to compare your current bike with a future one.

Carbon frames give more accurate geometry due to tighter tolerances and more precise manufactuirng techniques
To illustrate this point, let’s take two bikes with the exact same geometry and both claiming to have 160mm travel. You then discover that one bike is actually 10mm shy on travel, because the manufacturer thought 160mm sounded more enduro and fudged the figures. And it rubs both ways. The other bike could over-deliver by 5mm due to a shock that has a slightly longer stroke, but still within the acceptable manufacturing tolerance. Now, with both bikes set to 33 per cent sag, the bike with less travel will have a 5mm higher dynamic BB height, a steeper head angle and increased reach measurement. And that’s for two bikes with the exact same static geometry.
The reality gap
Now, you may have noticed that manufacturer’s claimed geometry rarely matches what we measure. And it’s not because anyone is trying to dupe you. It’s simply because manufacturers create their geometry charts from CAD drawings, which produces extremely precise results. The discrepancies arise because the manufacturing process isn’t quite as clean- cut as the binary world of computing. In the complex world of manufacturing there’s an acceptable margin of error known as the manufacturing tolerance.
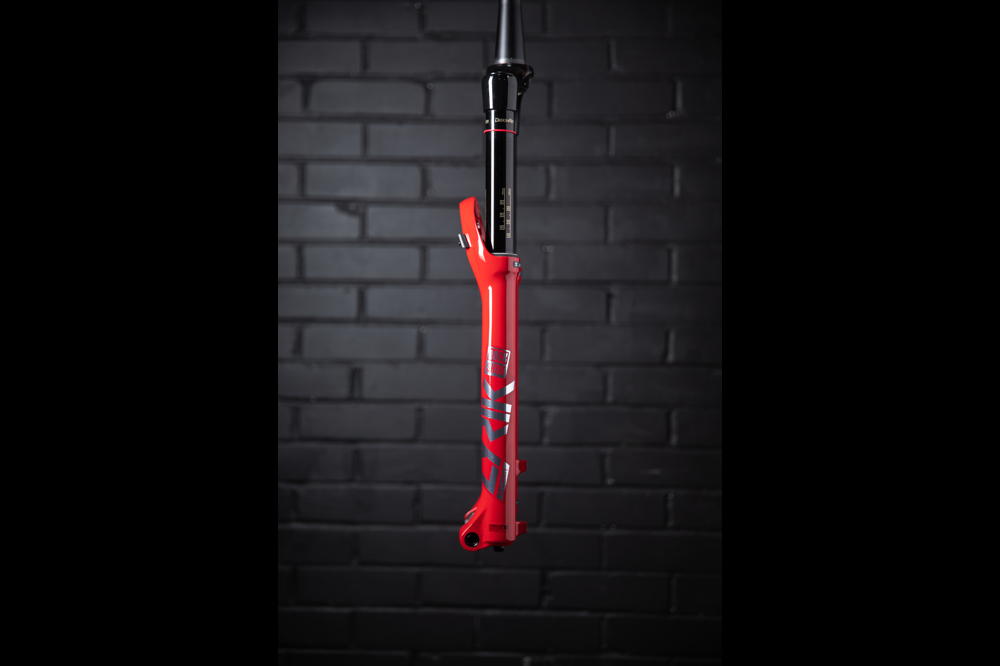
Axle-to-crown heights vary between forks with the same travel
Each individual component part has one, and the more parts you stack on top of each other, the greater the acceptable range.
On a rear shock it is +/- 1mm. So a 200mm eye-to-eye shock could in fact be 199mm or 201mm, or anywhere in between. On a 140mm fork with an axle-to-crown height of 550mm, the total range of variation could be as much as 10mm, so two identical bikes with fork lengths at opposite ends of the manufacturing bell curve could produce a 0.5º variation in the head angle from the fork alone.

Inaccuracies in YT’s geometry chart highlighted an issue with the BB height that could raise a red flag at checkout
But we’re getting ahead of ourselves. Geometry starts with the frame, and while manufacturers can be very accurate with the dimensions of each specific element of the frame, including tubes and forgings, when it comes to alloy frame manufacturing, you have to allow for the distortion that goes hand-in-hand with welding all of the parts together. More complex shapes with more welds mean more distortion. Heat treatment and alignment helps correct this, but even on a hardtail frame where there are no additional links, pivot placements or shocks to contend with, there’s still quite a lot of variation. So much so, that in the past Whyte shifted the head angle tolerance on its hardtails from +/- 0.5º to -1º. The overall range of variation remains the same, one full degree, but this move guaranteed that no frame would be steeper than claimed, and you could always be lucky enough to get an outlier that was one full degree slacker. Now that all of its bikes are genuinely slack, it’s shifted back to +/-0.5º tolerance on its head angles.
Factors to consider
As carbon frames are produced in a mould, the manufacturing is much more precise and the tolerances are much tighter. It’s something we’ve noticed first-hand by measuring test bikes month in, month out. And as carbon manufacturing continues to become more affordable, claimed geometry and measured numbers will continue to converge.
Now you have to bolt on all of the components, all of which will have their own tolerances. As we have already outlined, the axle-to-crown height of one fork might be longer than another ‘exact’ same fork by as much as 10 millimetres. Also, the axle-to-crown height of, say, a RockShox Lyrik is higher than a Fox 36 with the same travel.

Whyte’s tweaked tolerances meant head tubes were often slacker than claimed
As bike manufacturers mix and match kit across the model range, the geometry can change quite a lot, and most brands will not correct the geometry chart between models to reflect this variation.
Some brands actually try to account for it though. Take the Nukeproof Mega 290c Factory tested in this issue. It gets a 170mm-travel Fox 36 fork, while the top-of-the-range RC version comes stock with a 180mm-travel Lyrik. At first glace, it would appear that Nukeproof has seriously over-forked the flagship model. On closer inspection, however, both models share remarkably similar geometry thanks to the Lyrik’s stronger negative air-spring that sucks the fork into its travel more at sag.

Vertical rear-wheel travel can be calculated using a spirit level
Less obvious, though, is how small changes in shock lengths impact geometry. As we mentioned earlier, it’s common for one shock to be longer or shorter than another by a millimetre or two. Factor in the leverage ratio of the suspension and that variation then gets amplified at the rear axle, leading to much larger discrepancies in geometry and travel – high-leverage ratio suspension designs amplify it more than low-leverage ones.
With air shocks, the influence of the negative spring can’t be ignored either. The effect of the negative air spring varies widely between shock brands and even for different designs from the same brand. One thing that’s common to all modern air shocks though, is that once the negative spring is charged, it instantly reduces the stroke and subsequently the overall length of the shock. It’s probably the single biggest factor in the mismatch between claimed geometry and real-world numbers, and goes a long way to explaining why seven out of the eight bikes we compared were slacker than claimed.

To size up your head and seat angle, calibrate a digital angle finder…

…and measure away, safe in the knowledge that the figure is accurate to 0.1°
It also accounts for discrepancies in travel. And it’s why we measure the travel of the test bikes with the shocks fully topped out (extended). Yes, you could argue that you’ll never be able to use the travel that the negative spring eats into, as the shock can never fully extend, but by eliminating the influence of the negative spring, it offers us a more consistent way to measure frame travel across models with different shocks. That said, we’re still not 100 per cent convinced that it’s the best way to do it, as you could argue that we should also measure the geometry with the shock fully extended, which we don’t.
Still, it’s a nice segue onto the topic of human error. Typos are not uncommon… at least we hope they are typos. When we made the comparisons between actual and claimed figures back in November 2019, we found several wild innaccuracies. Having said that, since then, most brands have corrected the mistakes – perhaps having read this feature at mbr.co.uk! Just look at the wheelbase for the Whyte T-130: our test bike is 83mm longer than claimed! That can only be an honest mistake. Nevertheless, the error remains, and in fact all the T-130 wheelbase figures were way out. Then there’s the BB height on the Commençal Meta TR 29. There was a 45mm variation between claimed and actual figures. Again, that has to be an error uploading the info to the website. It’s even more important for direct-sales brands to get the input data correct, as you can’t just pop into a shop armed with a tape measure to double check it.
This was really brought home to us on the YT Capra 29 launch. On arriving late to the launch, we waltzed into the presentation room, took one look at the geometry chart and declared that the BB was too high. Having recently finished a 29er enduro bike test, one look at the geo chart was enough to convince us YT had it wrong. Thankfully, we had the presence of mind to apologise for our presumptuous remark, and back pedalling as fast as possible, we quickly said we should ride the bike before judging it, as it’s the dynamic geometry that matters not static numbers on a chart. Two full days of shredding later and not once did we feel that the BB on the Capra 29 was too high. Then we measured it and discovered it was 15mm lower than claimed. No wonder it didn’t feel high. The point being, the BB height would have been an instant red flag to a customer looking at the bike online. Also, riders buying online tend to be more experienced and have a better idea about what they are after, so it’s critical that the geometry is listed accurately and represents the bike.
Tyre size can impact BB height too. A 2.35in Schwalbe tyre is bigger than a 2.4in Maxxis, so BB drop is a more useful comparison than BB height when comparing bikes with the same wheel sizes – unless you’re comparing mbr test bikes. That’s because, to ensure BB heights are consistent across our test bikes within a comparison test, we measure them with the same Maxxis control tyres fitted. Obviously, if you’re looking at manufacturers’ websites and comparing different models, the tyre spec may well be different and you’re probably not going to get a true idea of relative heights. So when comparing manufacturers’ charts, it’s much better to use BB drop figures (if published) as these won’t be skewed by tyre spec.
Typo alert
And it’s not just the direct-sales brands that get it wrong. Take the Specialized Stumpjumper Evo. On the Specialized website last year, the size S2 was listed as the bigger frame, while it’s actually the S3 that is the larger of the two sizes on offer. The list goes on. We’re guilty of it too, as it’s easy to transpose a couple of digits and type 432mm BB height when you meant 324mm. The fact that 432mm is a common chainstay length makes the typo even harder to spot.
The more you study and understand bike geometry, the easier it is to read and spot mistakes when things just don’t add up. Back to the Stumpjumper Evo. The actual head angle is steeper than claimed, but the wheelbase is longer. Eh? That doesn’t make sense, as the opposite should be true. Something else must be at play here. And the problem is reversed with the regular Stumpjumper Expert Carbon: here the head angle is slacker than claimed but the wheelbase is shorter. Very odd!
Measure it!
With so much variation, what’s the best way to figure out the actual geometry of your bike? Measure it, of course. Armed with nothing more than a tape measure, you can get your BB height, chainstay length, top tube, reach or wheelbase in minutes. Granted, measuring the head and seat angles isn’t so straightforward but with a spirit level and a £20 digital angle finder from Wixey it takes seconds. Simply place the spirit level between the contact patches of the tyres to average out any anomalies in the floor, zero the angle finder on the spirit level, then measure the head and seat angle. It’s accurate to 0.1º, whereas the angle finder on your phone can be out by more than 0.5º
Measuring vertical wheel travel is more complex, but well worth the effort. To figure it out, put a spirit level or a straight-edge on the saddle so it extends out over the rear axle then secure it in place with a couple of straps. Mark the spirit level directly over the rear axle. Deflate the shock, then put a ratchet strap around the rear wheel and the frame and crank it down until the shock bottoms out. Make a note of the distance between the mark on the spirit level and the rear axle. Remove the ratchet strap, inflate the shock then measure the distance from the mark on the spirit level to the rear axle. Simply subtracting the first measurement from the second will give you the vertical wheel travel with the shock topped out. It’s also worth checking how much clearance there is at bottom-out between the seatstay bridge/tyre and the back of the seat tube, as this will determine how much wiggle room you have to adjust your geometry. As we outlined in part two of this geometry series, the most cost-effective way to make your bike lower, slacker and more stable is to fit offset shock hardware. But to do that you need adequate clearance at bottom out.
So the take-home message from all this number crunching is to always take the quoted numbers with a pinch of salt, and the more information you can arm yourself with before buying, the better. Oh, and always check out the reviews on mbr.co.uk or in the magazine if you want real-world numbers!
So you can begin to see that even half a millimetre here and half a millimetre there can start to add up, and lead to the actual geometry deviating quite a bit from the published figures. Enough of the theory, let’s look at a few real world examples:
Real-world example: carbon bikes
Canyon Strive CF 6.0 (size large)
Claimed figures Actual figures Difference
Head angle 66° 65.3° -0.7°
BB Height N/a 334 n/a
Wheelbase 1,230mm 1,229mm -1mm
Rear wheel travel 150/135mm 149/139mm -1/+4mm
Specialized Stumpjumper Expert Carbon FSR (size large)
Claimed figures Actual figures Difference
Head angle 66.5° 65.9° -0.4°
BB Height 342mm 333mm -9mm
Wheelbase 1,201mm 1,198mm -3mm
Rear wheel travel 140mm 135mm -5mm
Trek Fuel EX 9.8 (size large)
Claimed figures Actual figures Difference
Head angle 66º 65.5º -0.5º
BB Height 339mm 337mm -2mm
Wheelbase 1,211mm 1,215mm +4mm
Rear wheel travel 130mm 129mm -1mm
YT Jeffsy 29 CF Comp (size XL)
Claimed figures Actual figures Difference
Head angle 66.5º 66.3º -0.2º
BB Height 341mm 335mm -6mm
Wheelbase 1,244mm 1,250mm +6mm
Rear wheel travel 140mm 130mm -10mm
YT Capra 27 CF Pro (Size large)
Claimed figures Actual figures Difference
Head angle 65º 64.9º -0.1º
BB Height 346mm 346mm 0
Wheelbase 1,215mm 1,215mm 0mm
Rear wheel travel 170mm 166mm -4mm
Real-world example: alloy bikes
Whyte T-130S (size large)
Claimed figures Actual figures Difference
Head angle 65.6º 65.3º -0.7º
BB Height 330mm 320mm -10mm
Wheelbase 1,138mm 1,221mm +83mm
Rear wheel travel 130mm 125mm -5mm
Commencal Meta TR 29 British Edition (size large)
Claimed figures Actual figures Difference
Head angle 66.5º 65.7º -0.8
BB Height 380mm 335mm -45mm
Wheelbase 1,218mm 1,230mm +12mm
Rear wheel travel 130mm 124mm -6mm
Specialized Stumpjumper Evo Comp Alloy 29 (size S3) sizes wrong way round on spesh site)
Claimed figures Actual figures Difference
Head angle 63.5º 63.9º +0.4º
BB Height 328mm 333mm +5mm
Wheelbase 1,252mm 1,260mm +8mm
Rear wheel travel 140mm 134mm -6mm
Trek Remedy 8 (size large)
Claimed figures Actual figures Difference
Head angle 68º 65.8º -2.2º
BB Height 349mm 342mm -7mm
Wheelbase 1,206mm 1,199mm -7mm
Rear wheel travel 150mm 145mm -5mm
Giant Stance 2 (size large)
Claimed figures Actual figures Difference
Head angle 67.5º 66.4º -1.1º
BB Height n/a 332mm n/a
Wheelbase 1,174mm 1,179mm +5mm
Rear wheel travel 120mm 125mm +5mm